Playwright Trace Viewer: Debug Tests with Screenshots & Videos
Playwright Trace Viewer shows exactly why your tests fail with full execution visibility. Debug CI failures in minutes, not hours.
Looking for Smart Playwright Reporter?


Your Playwright test passes locally but fails in CI with a cryptic error message. No context, screenshots, or network logs. You're debugging blind, adding console.log statements and increasing timeouts, hoping to catch the failure locally.
Playwright Trace Viewer eliminates this guesswork. It records every action, screenshot, network call, and DOM mutation during test execution, creating a complete forensic record that you can replay step by step. This transforms debugging from hours of trial and error into minutes of targeted analysis.
This guide covers Playwright Trace Viewer setup, CI/CD configuration, debugging with screenshots and videos, how big trace files get, and how to control their size, and the newest trace features through Playwright 1.60, including:
- The first-class HAR recording API
- The trace CLI
- The retain-on-failure-and-retries mode
We also cover how TestDino eliminates the manual download-and-open trace workflow that slows down every CI debugging cycle.
Want to size your trace artifacts before touching your config? The free TestDino Playwright Trace Configurator predicts your total CI artifact size and hands you a ready-to-paste playwright.config snippet.
Why is the Playwright trace viewer essential for debugging tests
Test failures without context waste valuable development time. When your Playwright test breaks in CI, you get a generic "element not found" error with zero visibility into what actually happened. The application state is gone. Network requests are invisible. DOM snapshots have vanished.
Playwright Trace Viewer captures 5 critical data layers:
- Action Timeline - Every Playwright action with duration, status, and locator details. Identifies slow operations, unexpected retries, and the exact step that triggered failures.
- DOM Snapshots - Complete page state before and after each action. Inspect elements, verify selectors, and debug DOM structure changes that break your tests.
- Network Activity - All HTTP requests with headers, payloads, status codes, and timing. Failed API calls that prevent buttons from loading become immediately visible.
- Console Messages - Browser console output plus Playwright's internal logs. JavaScript errors and auto-wait explanations help determine if failures stem from application bugs or test logic.
- Screenshots & Videos - Visual confirmation of page state at each step. Spot overlapping UI elements, rendering delays, and layout shifts invisible in text logs.
Playwright 1.59 also introduced the page.screencast API for recording video with action annotations and chapter markers, giving richer video evidence than the older recordVideo option. See our Playwright MCP guide for the full screencast API walkthrough.
This visibility eliminates the "works on my machine" problem by showing the exact browser state during CI execution. You see timing issues like elements appearing and then disappearing before interaction. Backend errors that cause UI elements to never load become traceable.
Without Trace Viewer, debugging flaky Playwright tests means recreating failures locally and guessing at root causes. With Trace Viewer, you open the trace file, navigate to the failed action, and see the exact browser state that caused the problem.
How to use Playwright trace viewer to analyze screenshots and videos?
Playwright trace files are .zip archives containing screenshots, network logs, DOM snapshots, and action metadata. You can open traces locally via Playwright CLI or in a browser using trace.playwright.dev.
Opening Traces with Playwright CLI
The fastest way to analyze Playwright traces on your machine.
npx playwright show-trace path/to/trace.zip
This launches a local server and opens the Playwright Trace Viewer in your browser. The interface loads client-side, so trace data never leaves your machine, which is critical when traces contain authentication tokens or sensitive user data.
Exploring traces from the command line (Playwright 1.59)
Playwright 1.59 added npx playwright trace for exploring trace files without a GUI. This is built for AI coding agents that need to read trace data programmatically, but it's also handy when you're debugging over SSH or in environments without a display.
Open a trace, list actions, drill into a failure, and inspect the DOM snapshot:
# Open a trace file
$ npx playwright trace open test-results/example-chromium/trace.zip
# Filter actions by keyword
$ npx playwright trace actions --grep="expect"
  9. 0:00.859  Expect "toHaveTitle"  5.1s  ✗
# Inspect the failed action
$ npx playwright trace action 9
# View DOM snapshot at that moment
$ npx playwright trace snapshot 9 --name after
# Close when done
$ npx playwright trace close
The output is plain text. An agent reads what failed, checks the page state, and writes a fix. No browser window needed. For the full CLI command reference, see our Playwright CLI guide.
Browser-Based Trace Viewer
For quick analysis without installing Playwright, use trace.playwright.dev. Drag and drop your trace file or use the file selector. The viewer processes everything in-browser without transmitting data externally.
Open remote Playwright traces directly by URL:
npx playwright show-trace https://storedemo.cms.testdino.com/trace.zip
This eliminates the need to download trace files from CI artifacts. Tools like TestDino provide 1-click Playwright Trace Viewer access directly from dashboards, removing manual download steps entirely.
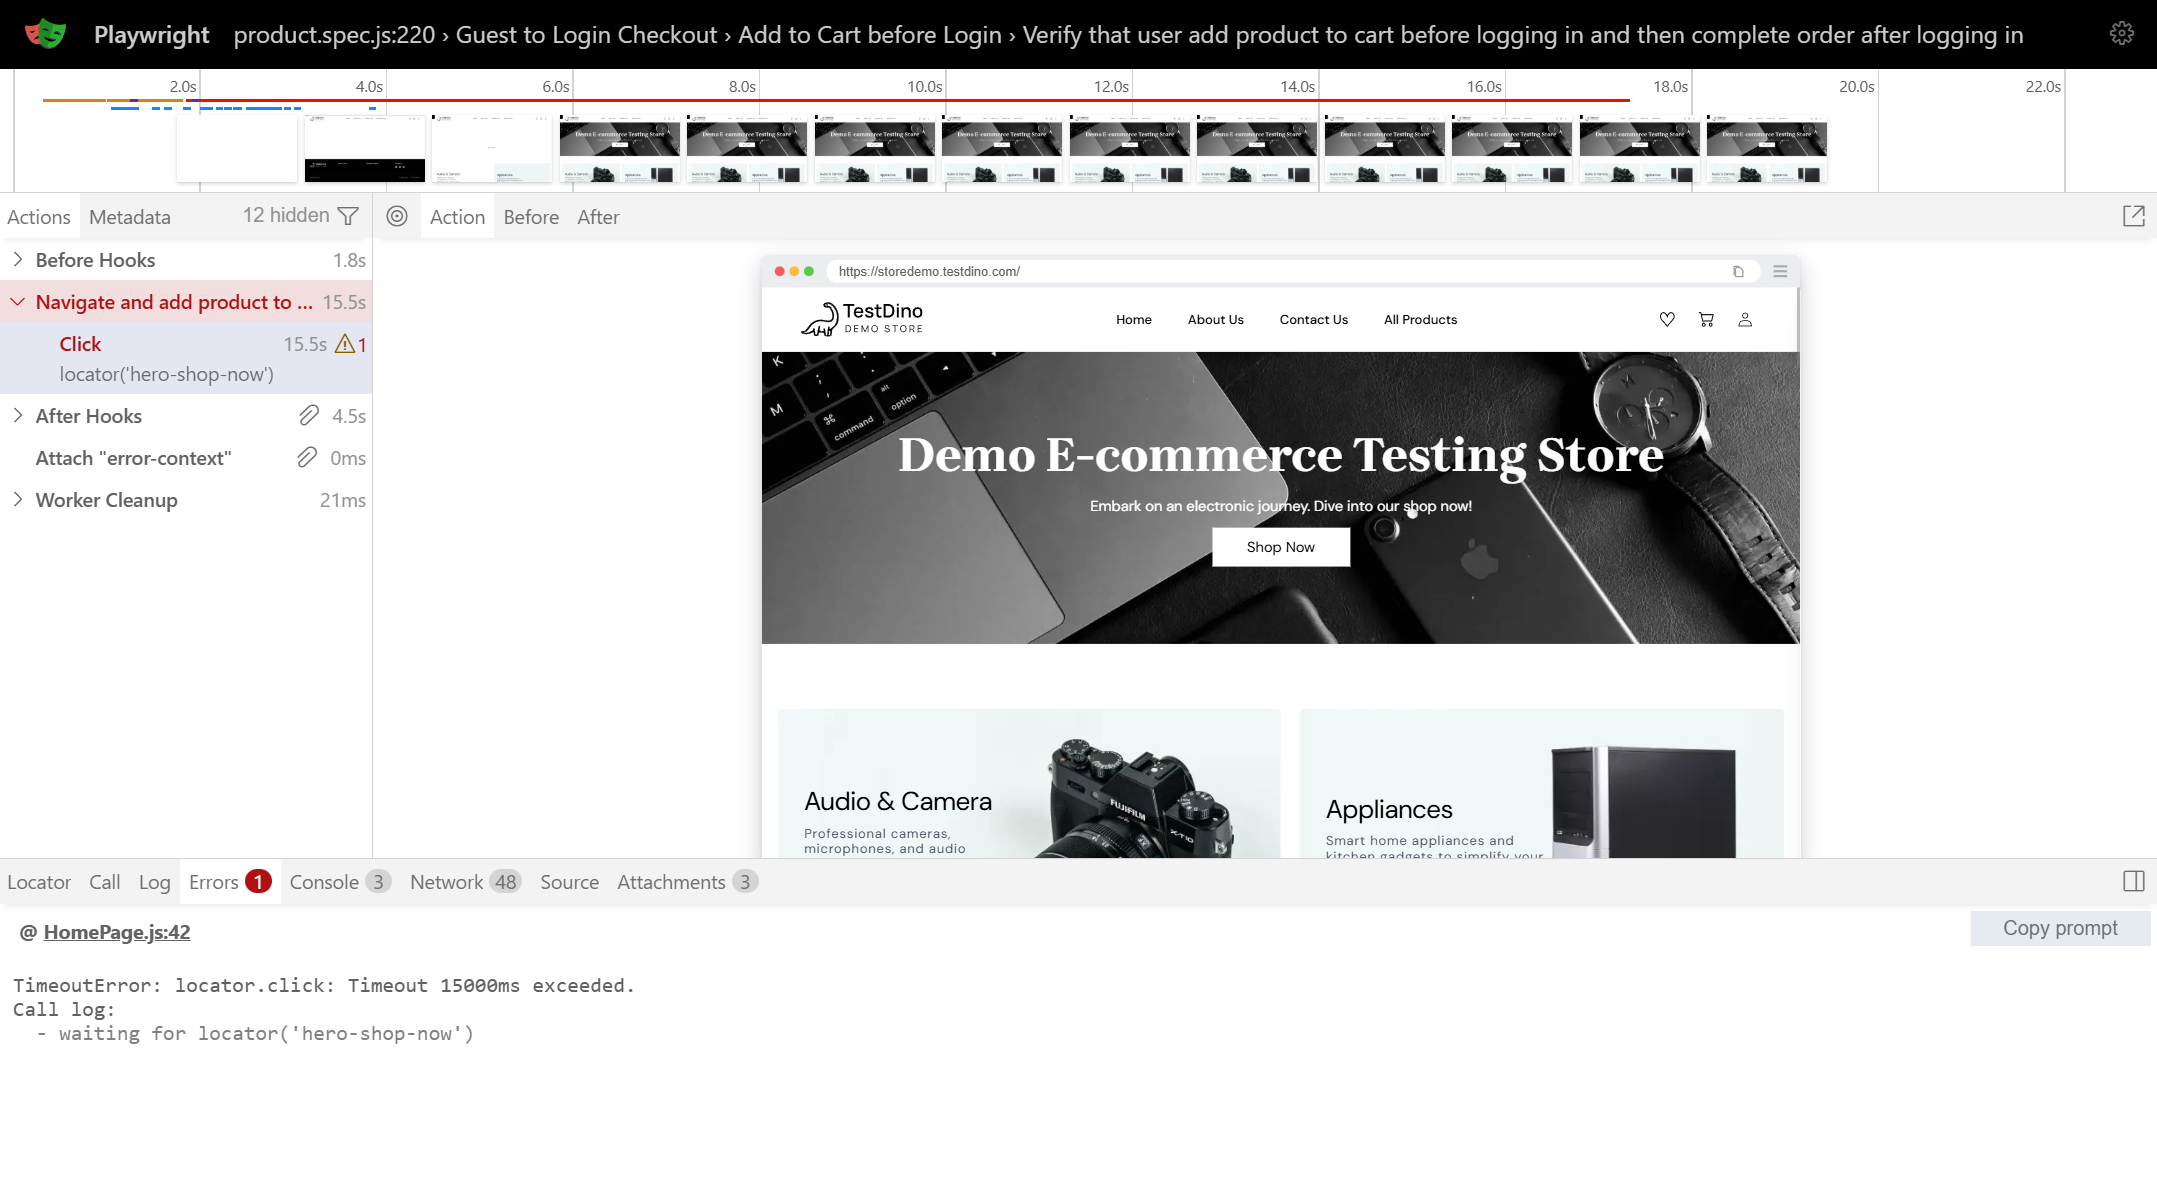
Navigating the Playwright Trace Viewer interface
The Actions tab shows a chronological timeline of every Playwright step. Click any action to see before/after states, execution time, and artifacts.
The Screenshots filmstrip displays a visual timeline. Hover for magnified views of each screenshot to spot visual changes or layout shifts. Double-click actions to zoom the timeline.
Before and After tabs show DOM snapshots captured around each action. Click elements to inspect properties, verify CSS classes, and confirm selector matches. This interactive inspection beats static screenshots because you can explore the full DOM tree and test different Playwright locators.
Playwright 1.59 also improved action filtering in both UI Mode and Trace Viewer, making it easier to search and isolate specific test steps in large traces.
Analyzing Network Activity in Trace Viewer
The Network tab lists all HTTP requests chronologically with method, URL, status code, response time, and payload size. Click requests for full headers, request bodies, and response data.
As of Playwright 1.60, the Network panel adds a pretty-print toggle for JSON and form request/response bodies. Hence, a minified API payload is readable without copying it into an external formatter. Playwright 1.60 also promotes HAR recording to a first-class tracing API via tracing.startHar() / tracing.stopHar() (with content, mode, and urlFilter options) when you need a standalone HAR alongside the trace.
Failed requests appear highlighted, making it easy to spot backend errors preventing UI elements from loading. Slow API responses are shown by timing bars, indicating when requests started and their duration. This identifies performance bottlenecks causing timeouts or flaky test behavior in Playwright.
Using Console Logs for Debugging
The Console tab displays browser console output and Playwright's internal logs. JavaScript errors and application logging appear alongside Playwright's auto-wait explanations.
Filter console messages by type, source, or search term. Double-clicking an action filters the console to show only messages logged during that action's execution. This correlation reveals why Playwright waited, retried, or failed at specific steps.
Debugging with DOM Snapshots
DOM snapshots preserve the complete page structure at each action. Unlike screenshots showing only visual state, snapshots let you inspect element attributes, CSS properties, and DOM hierarchy essential when debugging Playwright selector issues.
If your test fails with "element not found," the snapshot shows exactly what elements existed. Test different locators directly in the snapshot using the picker tool, verify target elements were present but hidden, or discover elements had different data attributes than expected.

Setting Up Playwright Trace Viewer in Your Tests
Configure Playwright tracing in your test setup file to automatically capture traces based on test outcomes.
Basic Playwright Trace Configuration
Add trace configuration to playwright.config.ts:
import {defineConfig} from '@playwright/test';
export default defineConfig({
   use: {
     trace: 'on-first-retry',
   },
});
This records Playwright traces only when tests fail and retry, balancing diagnostic value with storage efficiency. The trace captures everything needed to debug failures without generating unnecessary data.
Playwright Trace Mode
trace: 'on' - Records traces for every test. Use during active development when you need complete visibility. Generates large amounts of trace data and slows test execution.
trace: 'off' - Disables tracing entirely. Use for fast feedback loops when you don't need debugging artifacts.
trace: 'on-first-retry' - Captures traces only when tests fail, and Playwright retries them. Recommended for CI pipelines; provides debugging artifacts for failures without wasting storage on passing tests.
trace: 'retain-on-failure-and-retries' (added in Playwright 1.57) - Records a trace for every test attempt and keeps all of them when any attempt fails. This is the mode you want for flaky test debugging. It captures traces from both the passing retry and the failing run, so you can compare them side by side. What differed? A slow API? A missing element? A race condition? The comparison makes it obvious.
// Best for hunting flaky tests
import { defineConfig } from '@playwright/test';
export default defineConfig({
  retries: 2,
  use: {
    trace: 'retain-on-failure-and-retries',
  },
});
Programmatic Trace Control
For explicit control over when Playwright traces start and stop:
const browser = await chromium.launch();
const context = await browser.newContext();
await context.tracing.start({
  screenshots: true,
  snapshots: true,
  sources: true
});
const page = await context.newPage();
await page.goto('https://storedemo.cms.testdino.com/');
await context.tracing.stop({ path: 'trace.zip' });
Capture traces for specific workflows, record only authentication flow, or focus on particular user journeys. Screenshots provide visual verification, snapshots enable DOM inspection, and sources help correlate trace actions with test code.
Playwright 1.59 added a live option to tracing. When enabled, the trace file updates in real time as actions happen instead of being written at the end. Useful when tests might crash before tracing.stop() runs, or when you want to monitor progress mid-execution.
In Playwright 1.59+, the tracing APIs also return async disposables, so you can use await using to stop tracing automatically when the scope ends.
await context.tracing.start({
  screenshots: true,
  snapshots: true,
  live: true,
});
How big are Playwright traces, and how to control it
Trace files are not free. A single trace for a complex, multi-step test can run 10–50 MB, and a suite of hundreds of tests with trace: 'on' will generate gigabytes of artifacts per CI run, slowing uploads, inflating storage bills, and hitting artifact retention limits.
What actually drives trace size, largest contributor first:
| Capture option | Size impact | Keep it on? |
|---|---|---|
| Screenshots | Largest: a screencast frame per action | On for visual debugging; the first thing to drop if size is a problem |
| DOM snapshots | Medium: HTML before/after each action (powers the inspector) | On. This is what makes the viewer "time-travel" |
| Attachments (video, logs, custom files) | Medium-to-large, depends on what you attach | Selectively |
| Sources (test code) | Negligible | On, basically free |
The biggest lever is which trace mode you run. Going from on to a failure-scoped mode is the difference between tracing every test and tracing only the handful that actually break.
| Mode | What it records | Relative artifact size | Best for |
|---|---|---|---|
| off | Nothing | None | Fast feedback loops |
| retain-on-failure | Records all, keeps only failed | Low | Day-to-day CI |
| on-first-retry | Only the first retry of a failure | Low | CI default (recommended) |
| retain-on-failure-and-retries | Every attempt, kept on any failure | Medium | Flaky-test hunting |
| on | Every test, always | Very high | Local debugging only; never full CI |
Estimate before you run. Instead of guessing, use the TestDino Playwright Trace Configurator to predict your total CI artifact size from your test count, complexity, and failure rate (accurate to within ~30% of a real run) and copy a ready-made playwright.config snippet for the trace mode and capture options you pick.
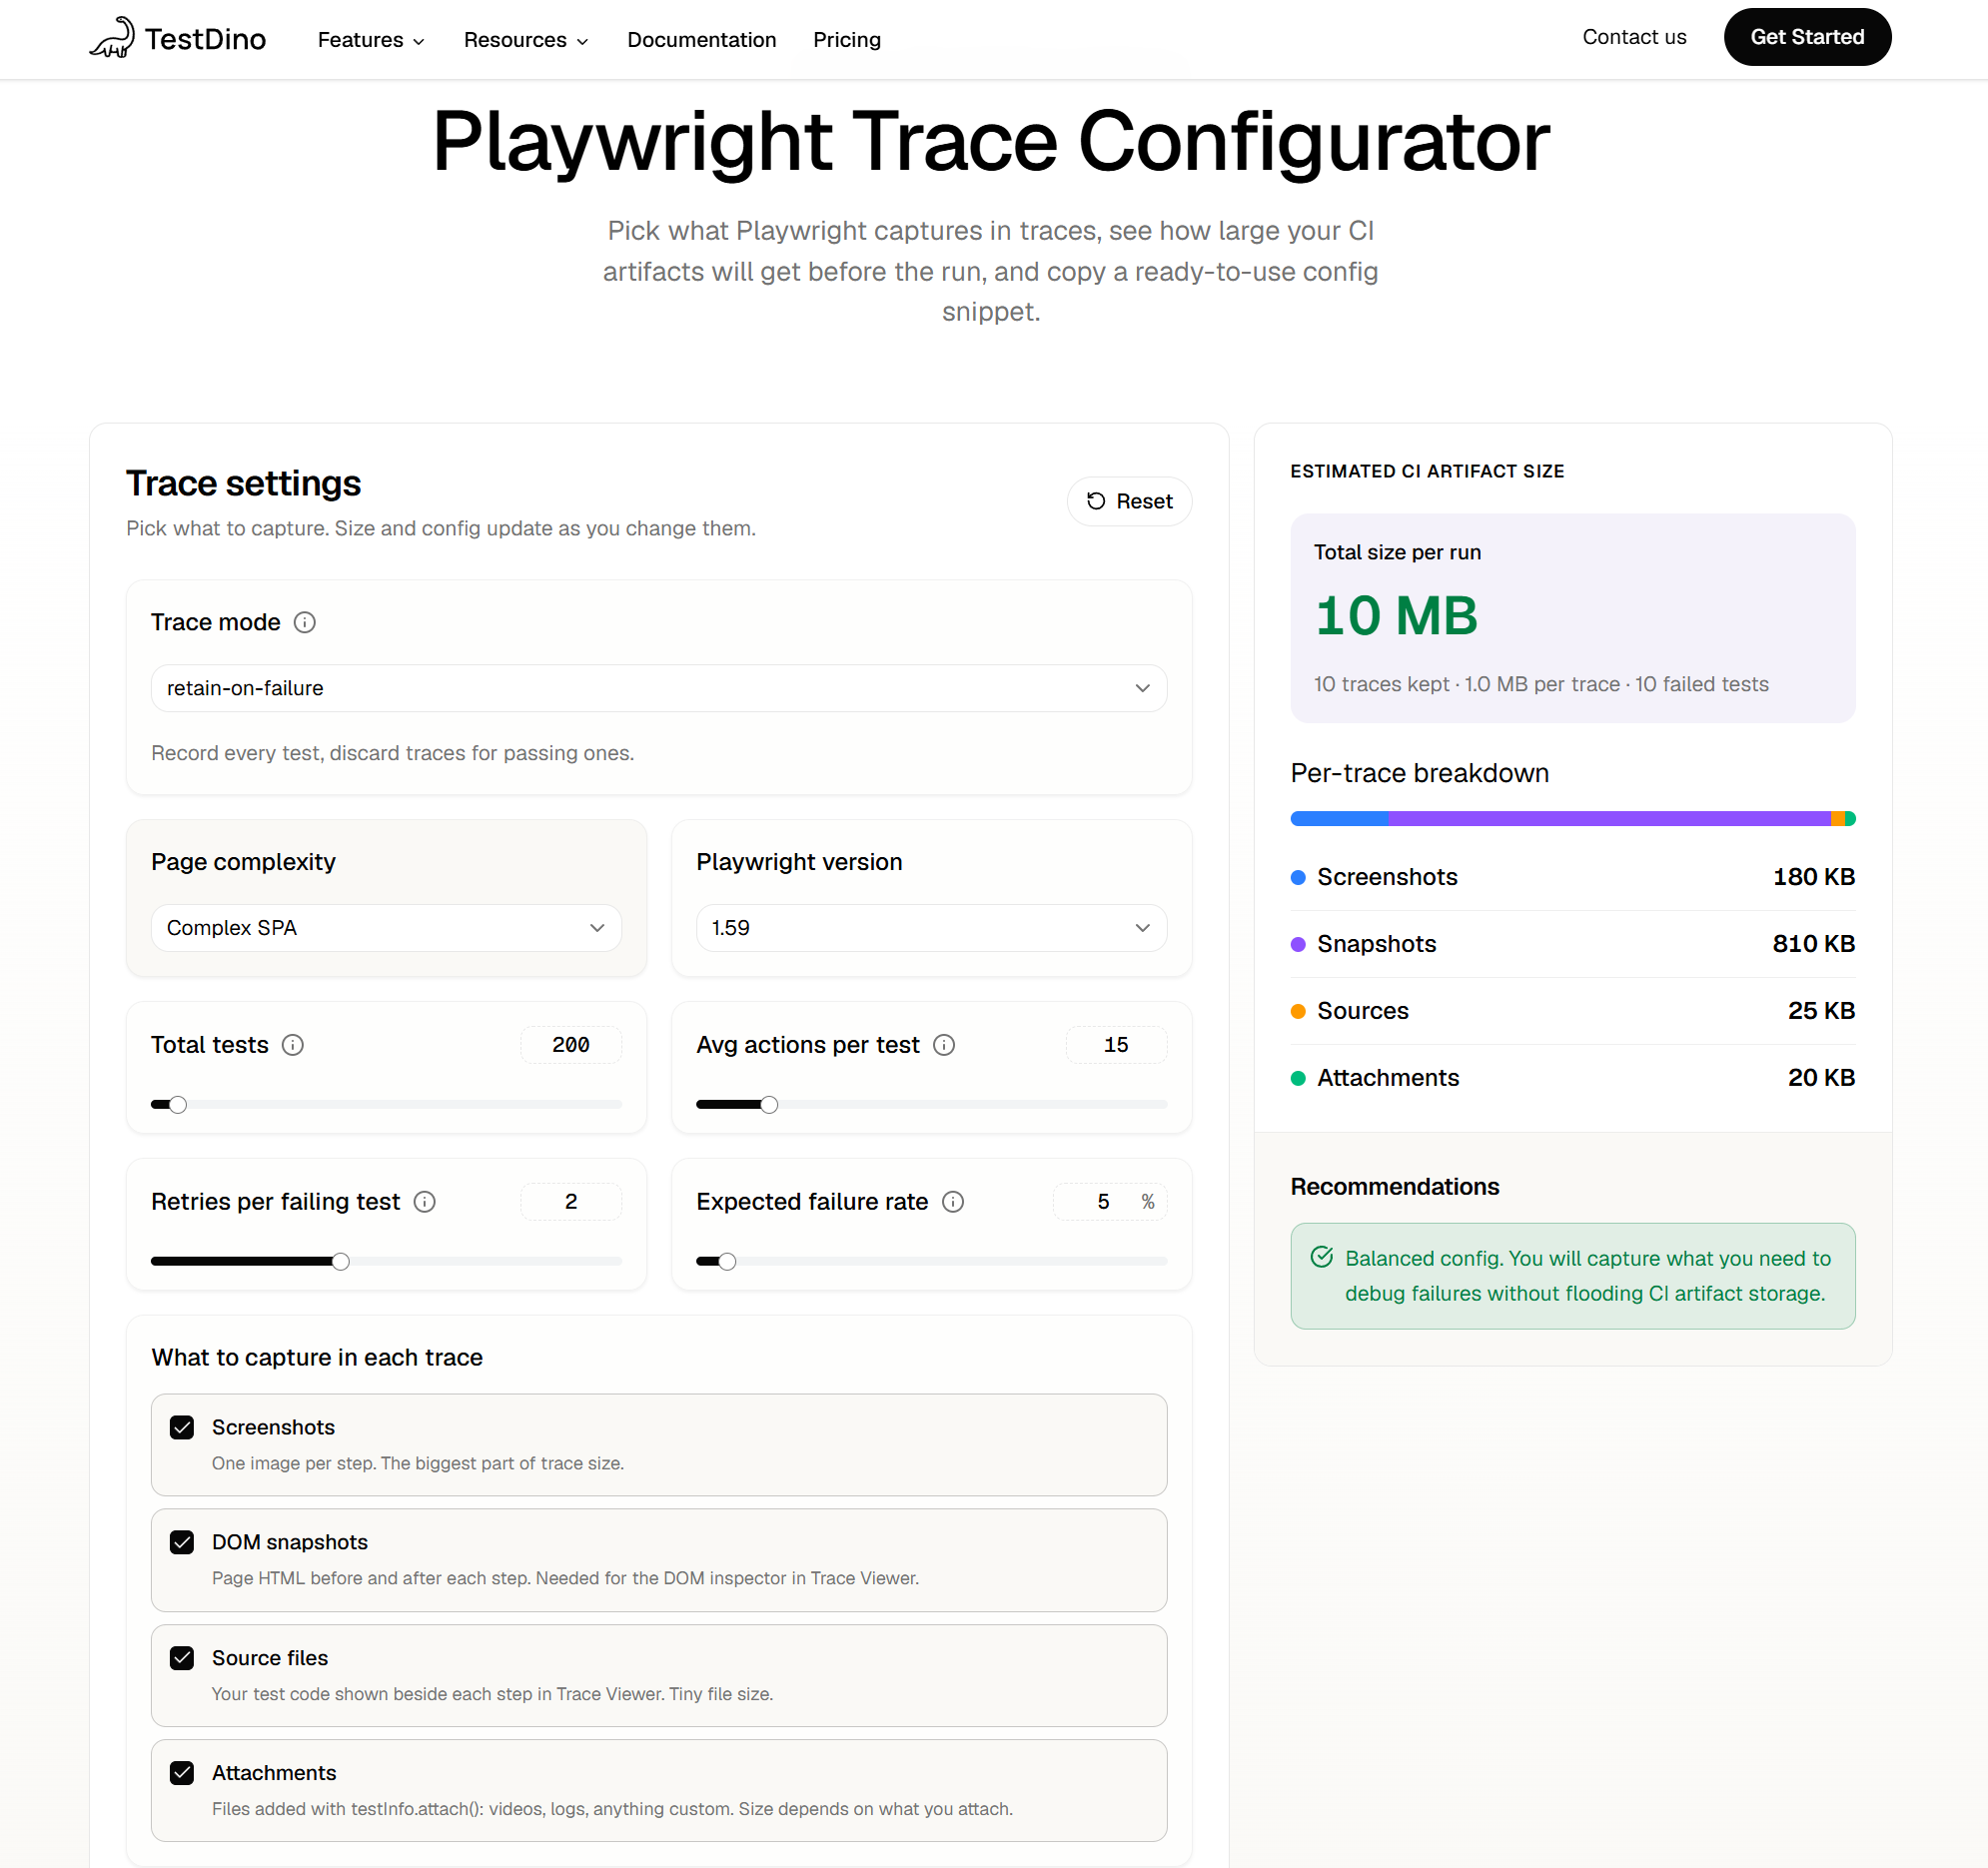
It shows the storage-vs-debuggability tradeoff for each mode side by side, so you choose with numbers instead of guesswork.
2 more housekeeping moves keep storage in check:
- Set artifact retention to 30–90 days in your CI provider so old traces expire automatically.
- Prefer on-first-retry over retain-on-failure for large suites. You only pay the size cost when a failure actually warrants investigation.
Integrating Playwright Trace Viewer with CI/CD Pipelines
CI environments create unique trace debugging challenges. Tests run headless on remote machines with different resources than development environments. Trace files are stored as build artifacts requiring manual download.
Configuring Traces for CI
Set up CI to capture Playwright traces on failure and store them as artifacts. In GitHub Actions:
- name: Run Playwright tests
  run: |
    npx playwright test
  env:
    CI: true
- name: Upload results to TestDino
  if: always() # Upload both passing and failing runs
  run: npx tdpw upload ./playwright-report --token="${{ secrets.TESTDINO_TOKEN }}"
- name: Upload trace artifacts
  if: failure() # Only upload traces on failure to save storage
  uses: actions/upload-artifact@v3
  with:
    name: playwright-traces
    path: test-results/**/trace.zip
The if: failure() condition ensures artifacts upload only when tests fail, saving storage and upload time for successful runs.
Not sure which trace mode keeps your artifact bill in check? Size your config with the trace configurator before this step ever runs.
Accessing Playwright Traces from CI
After failed CI runs, navigate to workflow artifacts and download the trace archive. Extract the zip and open using Playwright CLI or trace.playwright.dev. This manual process creates friction between failure detection and root cause analysis.
Modern CI debugging workflows integrate trace viewing directly into test reporting platforms. TestDino automatically processes Playwright trace files and provides 1-click access to the trace viewer from test results dashboards. Click a failed test and immediately see its trace, screenshots, and error details in one interface.
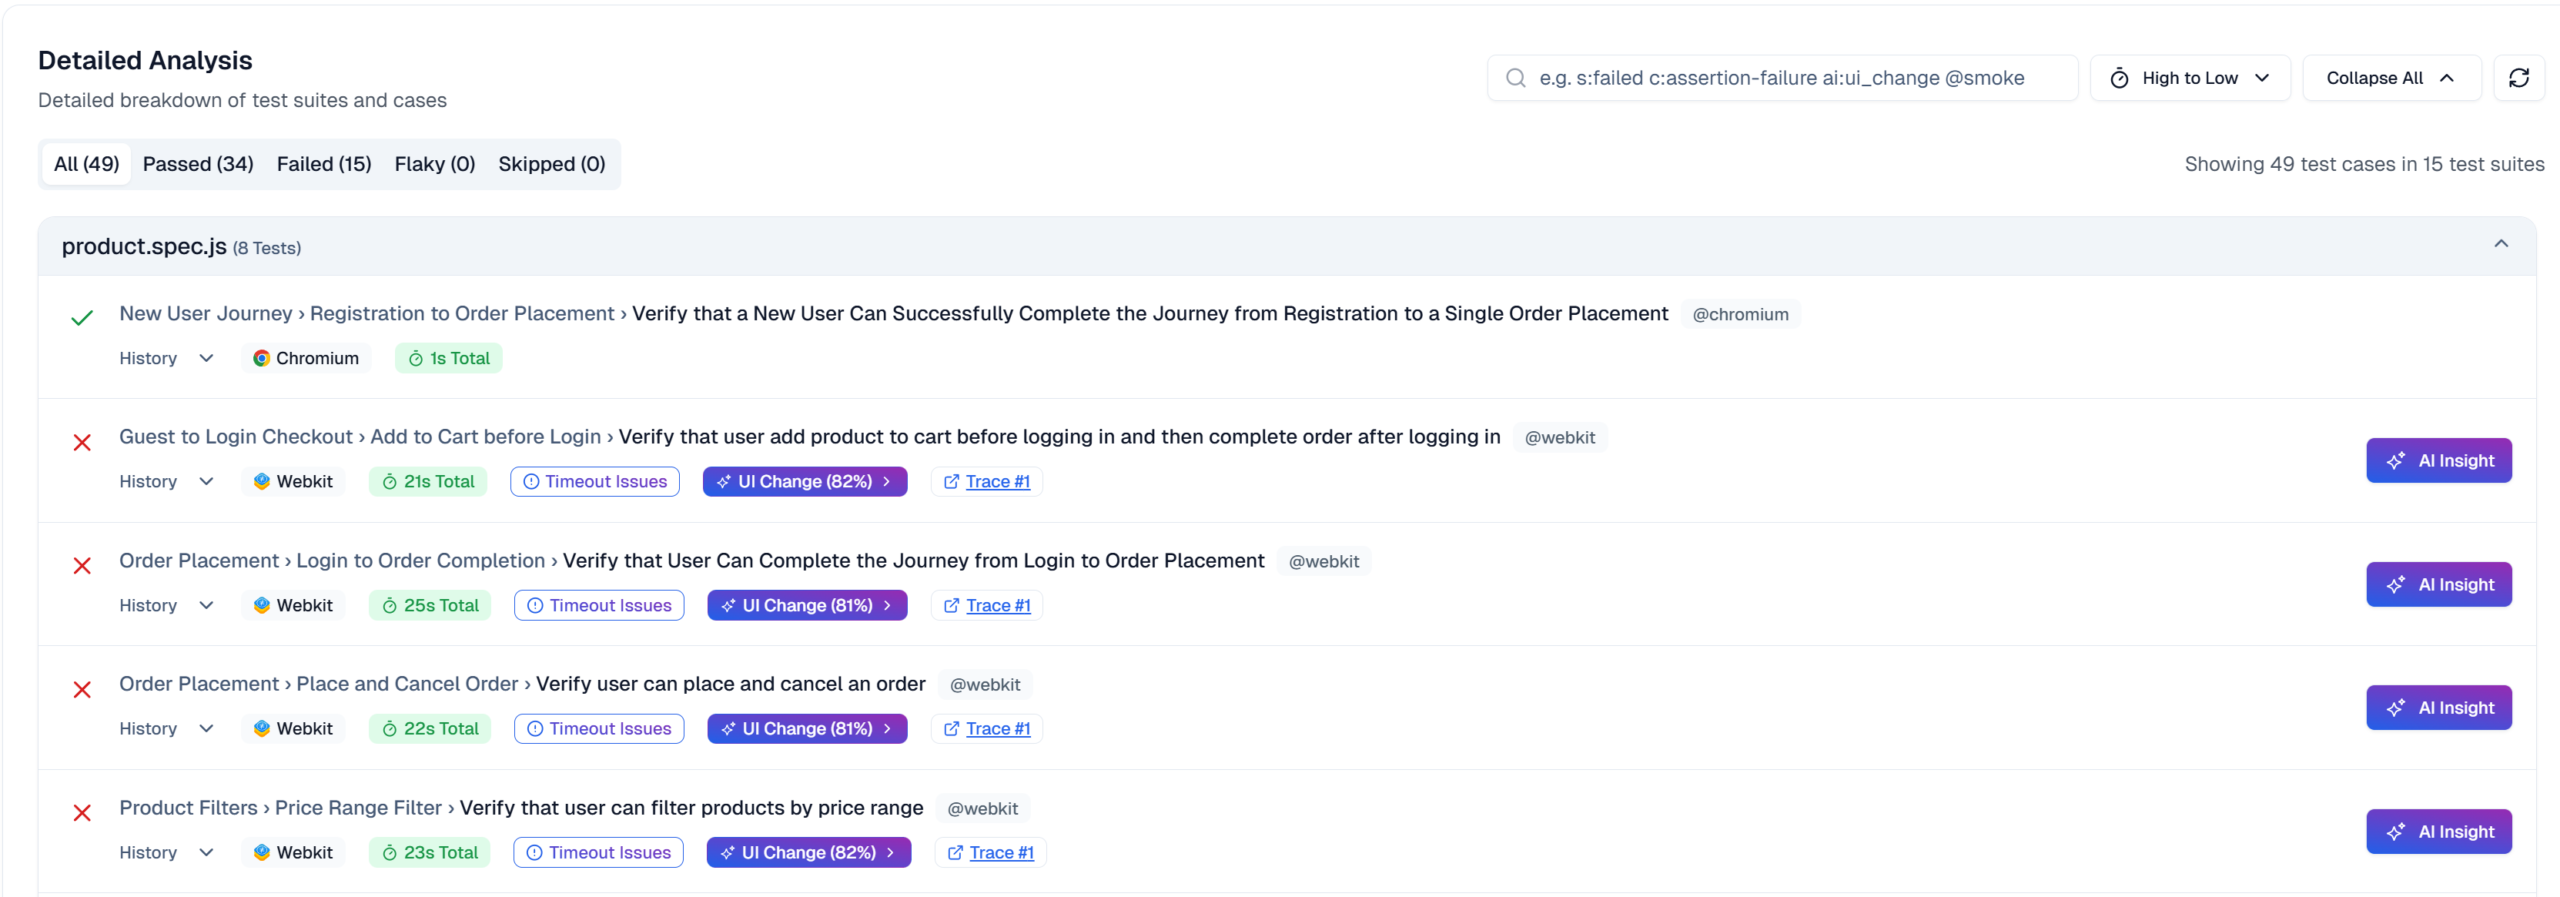
Analyzing Playwright Traces at Scale
When multiple tests fail in CI, opening each Playwright trace file individually becomes impractical. Centralized reporting platforms aggregate traces across all failed tests with filtering, search, and grouping capabilities.
TestDino's AI-powered failure classification automatically groups similar failures and identifies patterns across Playwright traces. Instead of analyzing 20 individual trace files for selector errors, you see a single failure group with representative traces and suggested fixes.
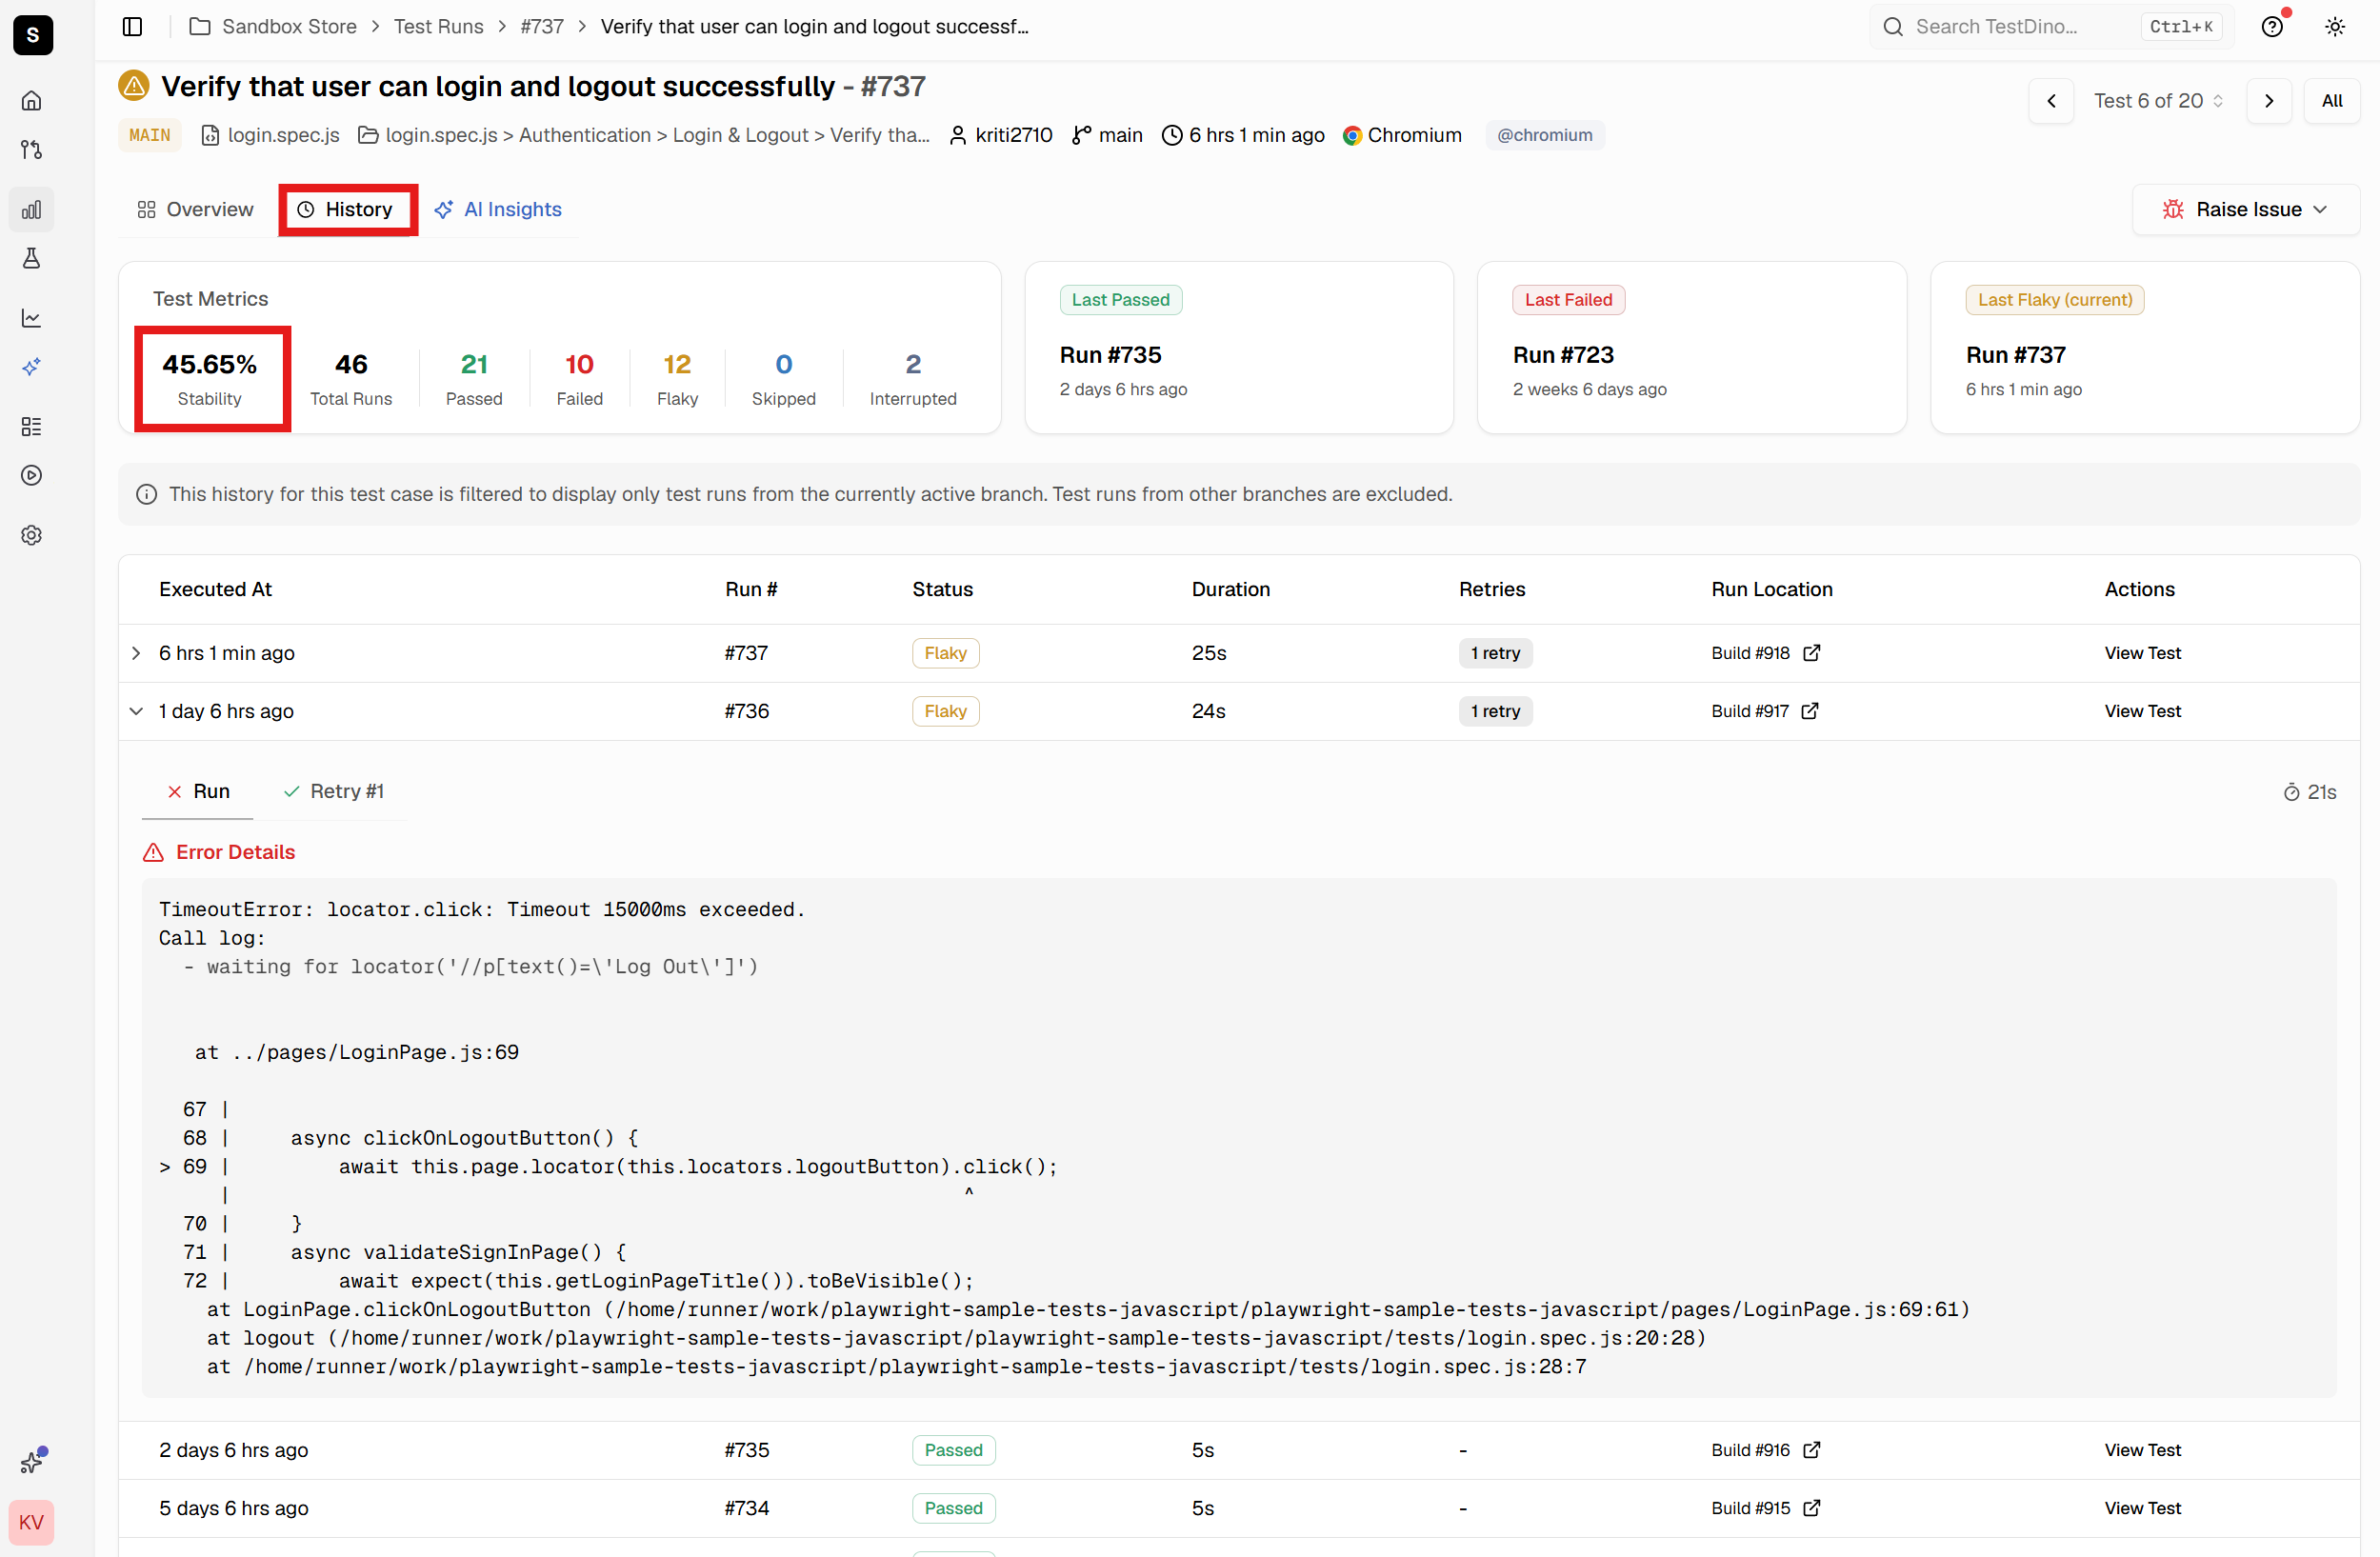
The platform tracks flaky tests over time, correlating retry patterns with specific traces. Historical trace data reveals whether flakiness stems from timing issues, network variability, or environmental differences.

How TestDino Enhances Playwright Trace Viewer Workflows
Standard Playwright trace workflows require manually downloading trace files from CI artifacts, running CLI commands, and switching between tools. TestDino streamlines this by centralizing all test artifacts with 1-click trace access.
Centralized Trace Access
When tests fail in CI, TestDino automatically uploads and indexes the Playwright trace file with screenshots, videos, and error details. Test results pages display all evidence in organized panels, with traces accessible via a single click. No downloading, no CLI commands, no context switching.
The trace opens in the native Playwright Trace Viewer running in your browser with full functionality. Same experience as opening traces locally, but without manual artifact management.
AI-Powered Failure Analysis
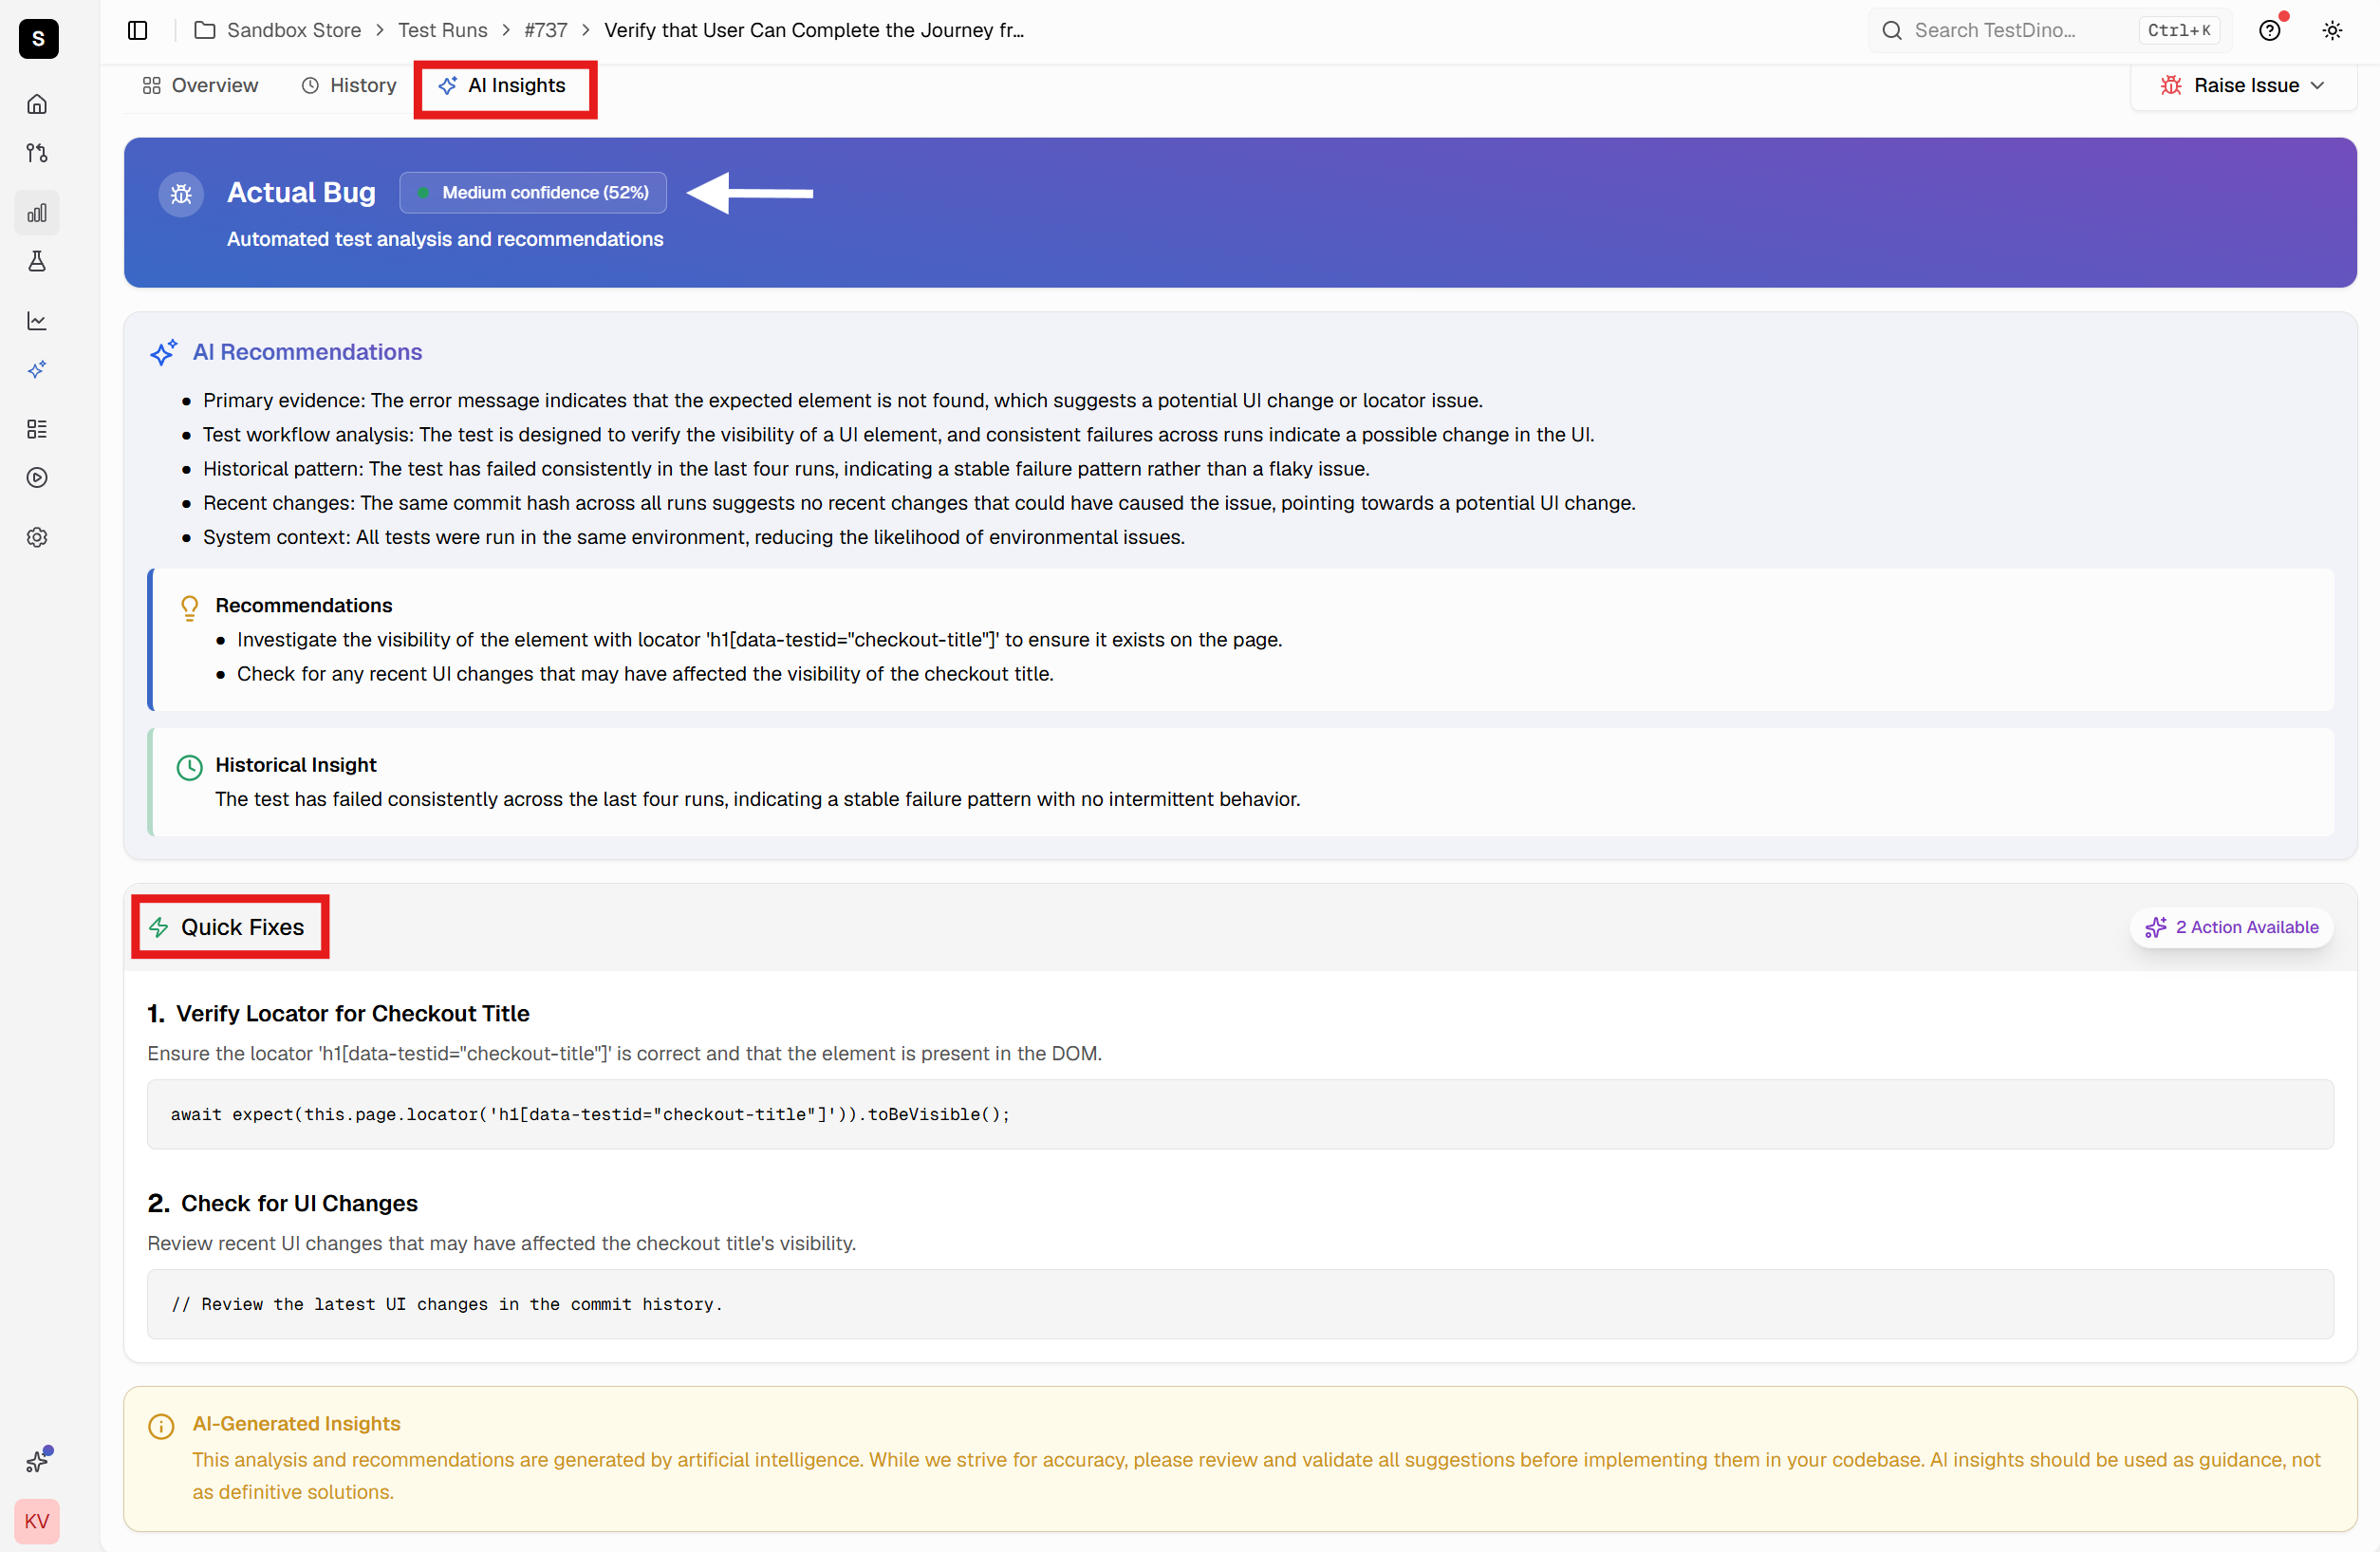
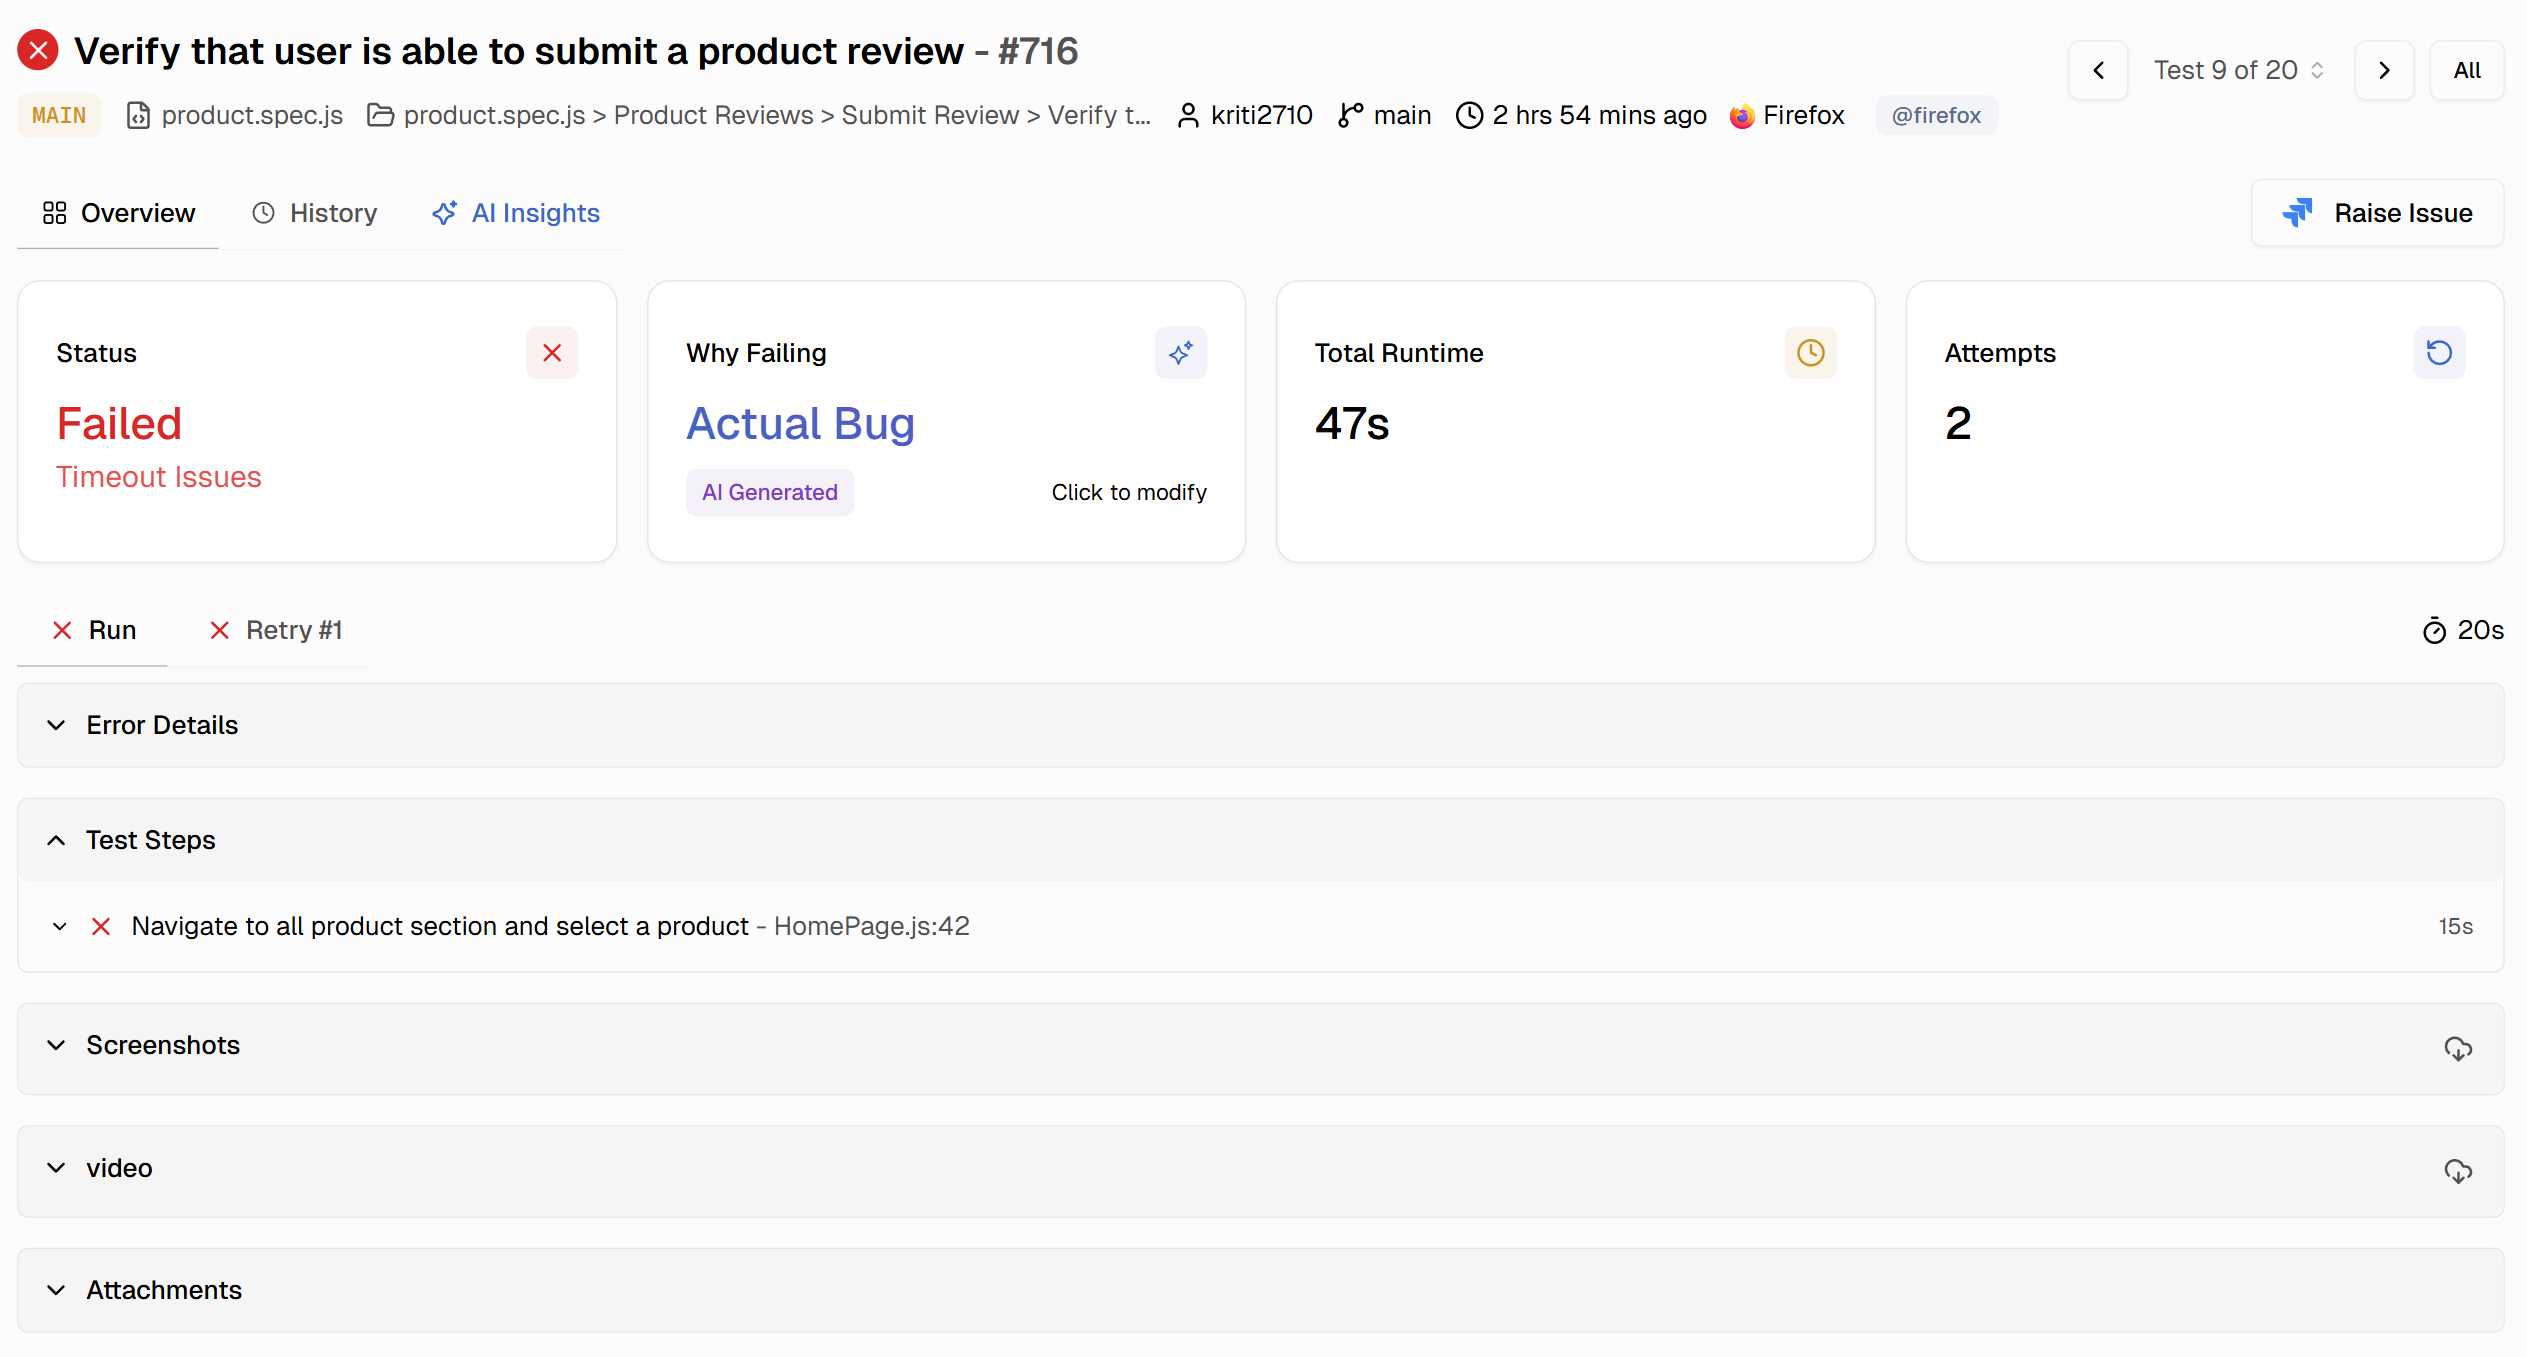
TestDino's AI analyzes Playwright trace data to classify failures by root cause. It examines error messages, stack traces, and trace patterns to determine whether failures represent actual bugs, UI changes breaking selectors, or flaky tests from timing issues.
Classification appears immediately when viewing test results before opening the trace. Instead of determining failure type, you start with that context and focus on solving the specific problem. AI provides confidence scores and suggested next steps based on failure type.
Historical Trace Analysis
Beyond individual trace inspection, TestDino tracks patterns across test runs over time. When tests become flaky, the platform correlates Playwright traces from passing and failing runs to identify environmental differences, timing sensitivities, or resource constraints triggering intermittent failures.
The analytics dashboard shows trends like increasing failure rates, new failure patterns after code changes, and tests failing only in specific CI environments. This historical context transforms reactive debugging into proactive stability improvement.
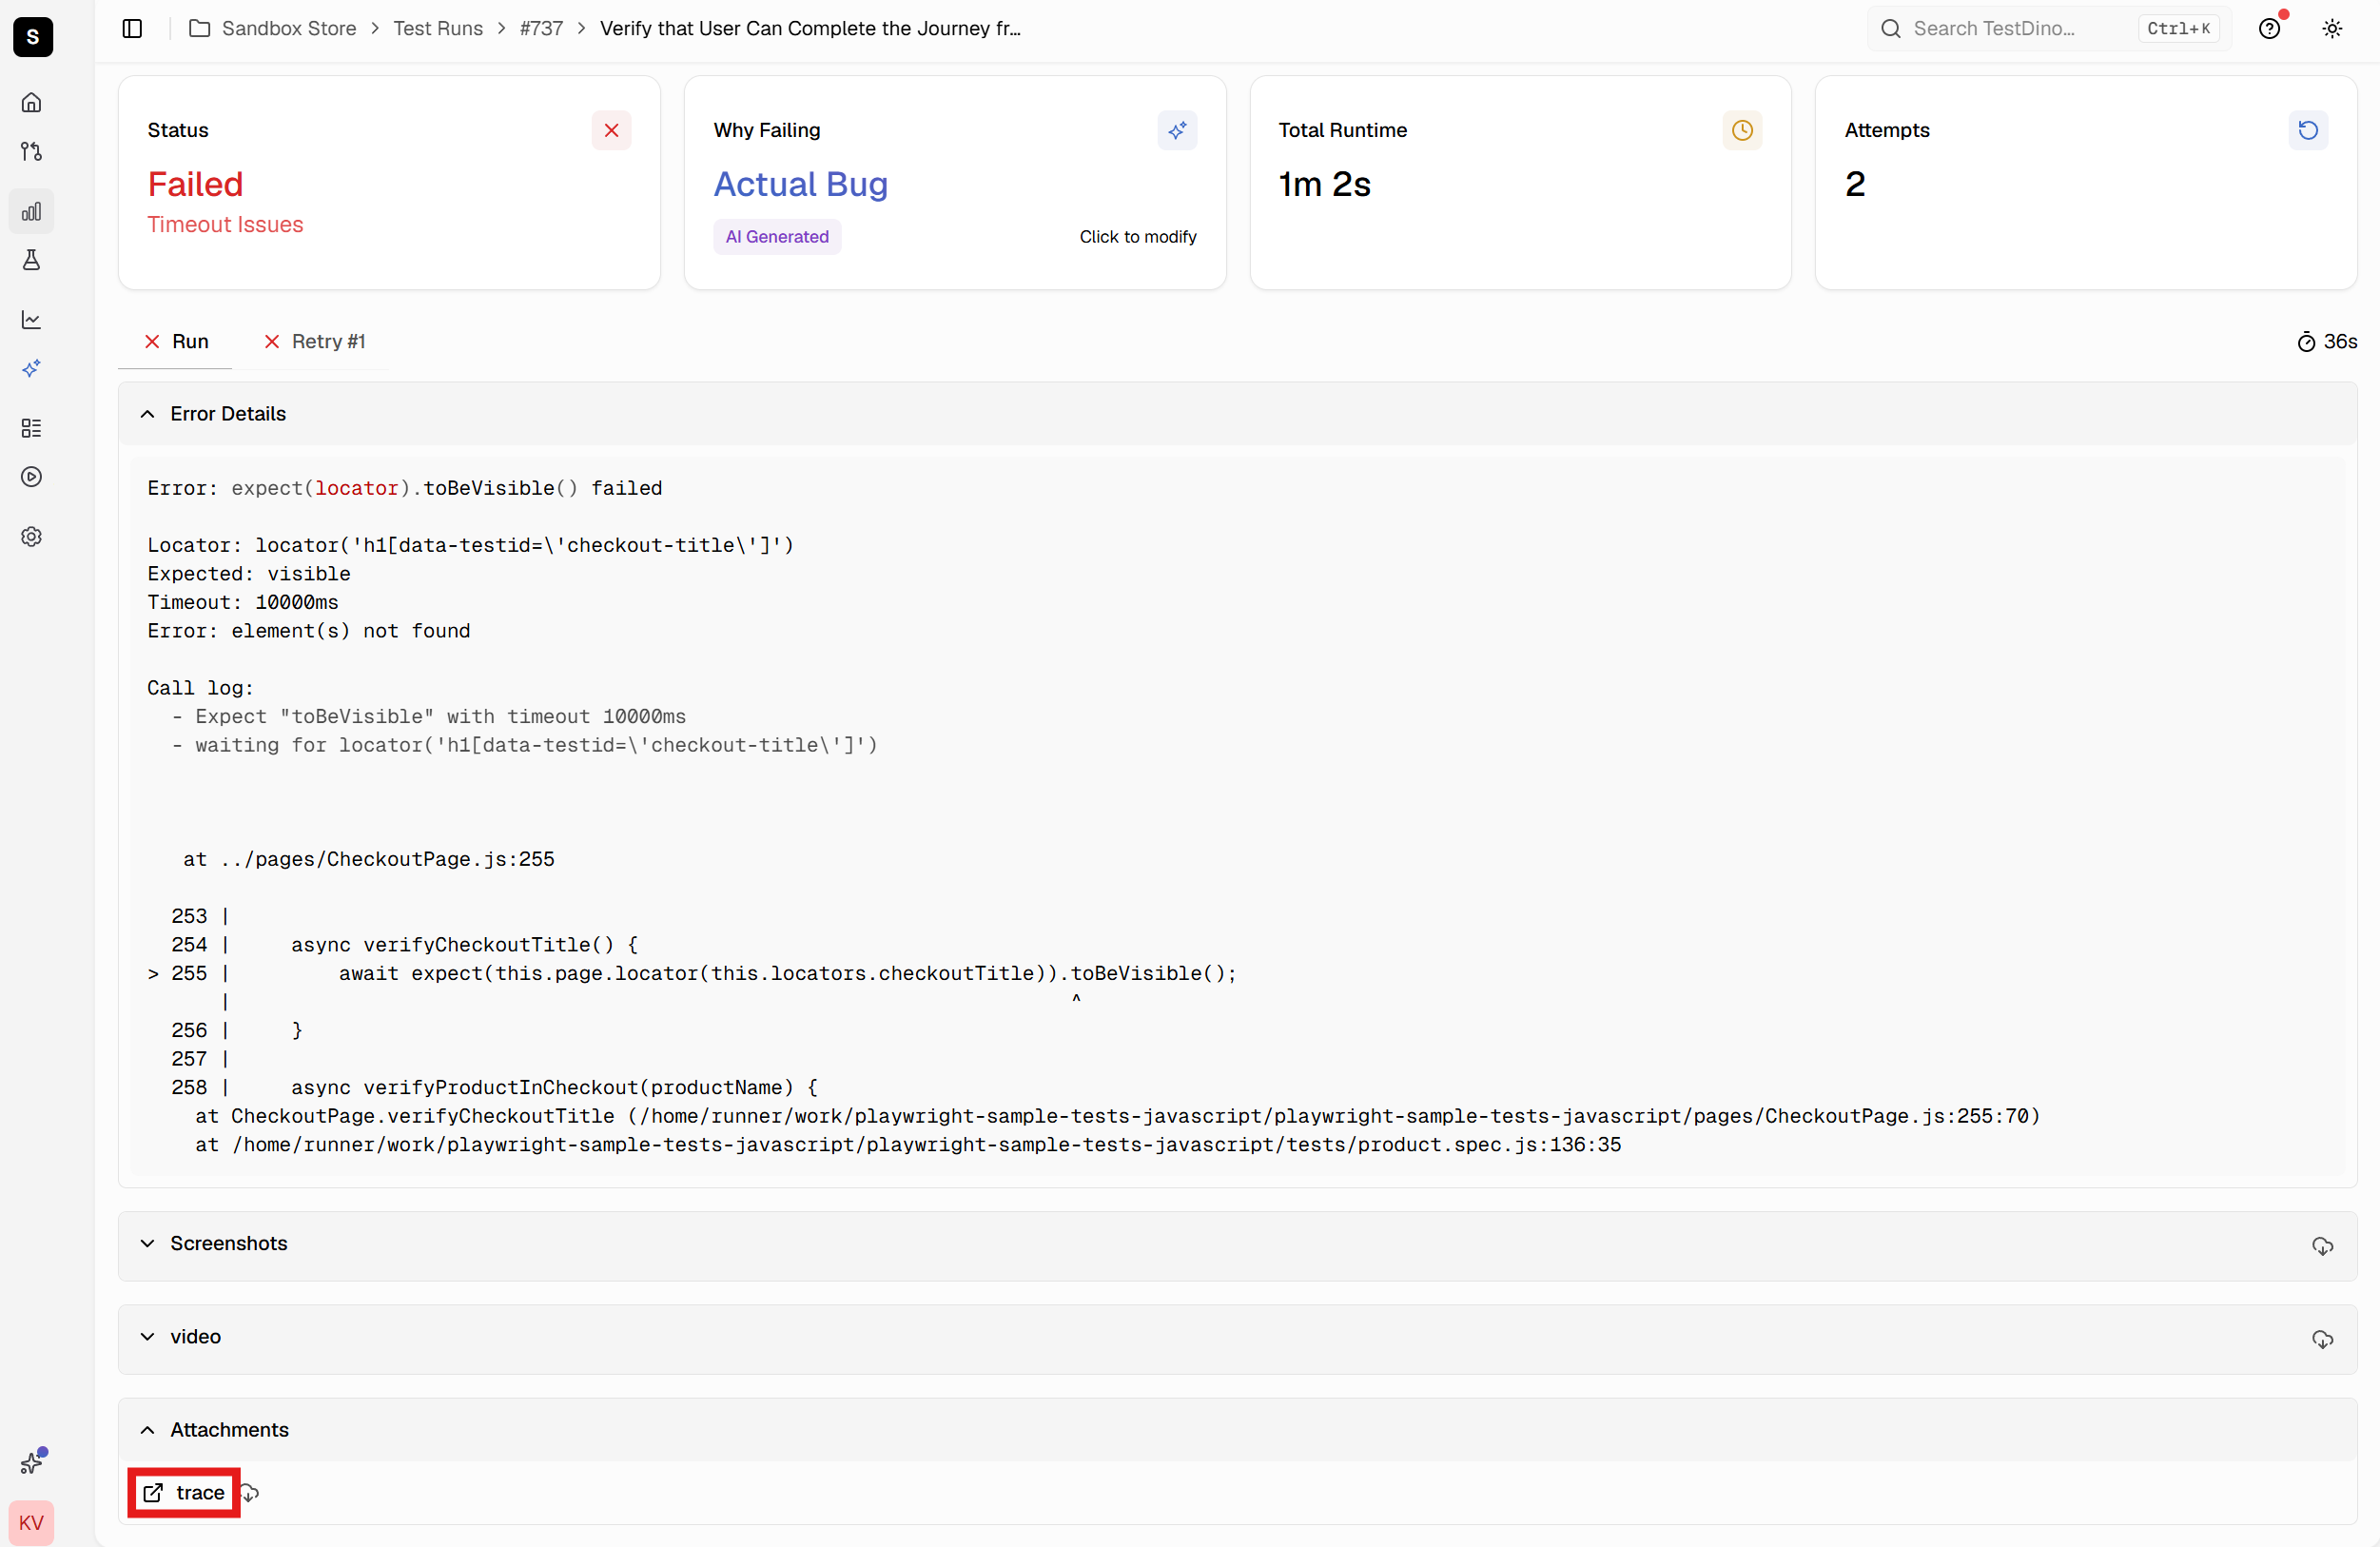
Integrated Evidence Panels
The test case view organizes all debugging artifacts in dedicated panels. Error details show exact error messages and stack traces. Test steps list each Playwright action with timing information. Screenshots display the page state at failure. The trace provides an interactive investigation of complete execution.
This eliminates gathering evidence from multiple sources. Everything required to debug the failure lives in one place, accessible from a single shareable URL.
Best Practices for Using Playwright Trace Viewer
Effective trace usage requires strategic configuration and analysis patterns.
Use Conditional Tracing in CI
Always use trace: 'on-first-retry' or trace: 'retain-on-failure' in CI environments. Never enable trace: 'on' for all tests in CI. Recording traces for passing tests wastes storage without providing value.
The exception: when actively debugging specific intermittent failures, temporarily enable tracing for problematic test files to capture traces from both passing and failing runs.
Start with Screenshots
When opening Playwright traces, start with the visual timeline. To identify where the application state diverged from expectations, skim the screenshots. Visual inspection often reveals problems faster than reading action logs.
If the failure is visual (wrong layout, missing elements), screenshots immediately show the issue. If functional (wrong data, failed navigation, timeout), screenshots show context, narrowing the investigation focus.
Check Network Logs for Backend Issues
Many test failures stem from backend problems manifesting as frontend issues. A missing button might be a failed API call, preventing button rendering. A timeout waiting for elements might be slow API responses, delaying page updates.
Always check the Network tab in Playwright Trace Viewer when investigating element visibility issues, timeouts, or data validation failures. Look for failed requests, slow responses, and unexpected error codes. With the 1.60 pretty-print toggle, inspecting a JSON response body no longer means copying it out to a formatter.
Compare Passing and Failing Traces
When debugging flaky tests, capture Playwright traces from both passing and failing runs. Load them in separate browser tabs and navigate to the same action. Compare screenshots, network timing, console logs, and DOM states.
Small timing differences, variable network latency, or race conditions become visible. A flaky test might pass when APIs respond in 200ms but fail at 400ms. The trace comparison shows this timing difference helping you fix root causes instead of just increasing timeouts.
TestDino automates this comparison for flaky tests by grouping multiple runs of the same test and highlighting differences between passing and failing attempts.
The retain-on-failure-and-retries trace mode automates the capture side. It keeps traces from every retry attempt, so you always have both the passing and failing executions without needing to run tests twice with manual tracing.
Conclusion
Playwright Trace Viewer transforms test debugging from guesswork into systematic analysis. Instead of adding console logs and hoping to catch failures locally, you get complete forensic records of test execution with screenshots, network logs, and DOM snapshots.
Configure tracing once in your Playwright config, and it automatically captures diagnostic data when tests fail. Open traces using CLI or browser-based viewer to investigate failures with interactive timeline navigation, DOM inspection, and network analysis. And before you commit a trace mode to CI, size it first with the trace configurator so debugging visibility doesn't cost you an artifact-storage surprise.
For teams running extensive Playwright test suites in CI, trace management becomes a workflow challenge. TestDino centralizes traces, provides 1-click access from test results, and uses AI to classify failures by root cause. The platform tracks flaky tests over time, correlates traces across multiple runs, and provides evidence-rich reporting that accelerates debugging for entire teams.
Start using Playwright Trace Viewer today by adding trace: 'on-first-retry' to your Playwright configuration. The next time a test fails in CI, you'll have everything needed to understand and fix the failure in minutes instead of hours.
FAQs
Table of content
Flaky tests killing your velocity?
TestDino auto-detects flakiness, categorizes root causes, tracks patterns over time.
Follow Us